The Dashboard Explained
The Dashboard is similar to a vehicle's dashboard; it gives information about how the vehicle, in this case your club, is performing in certain areas.
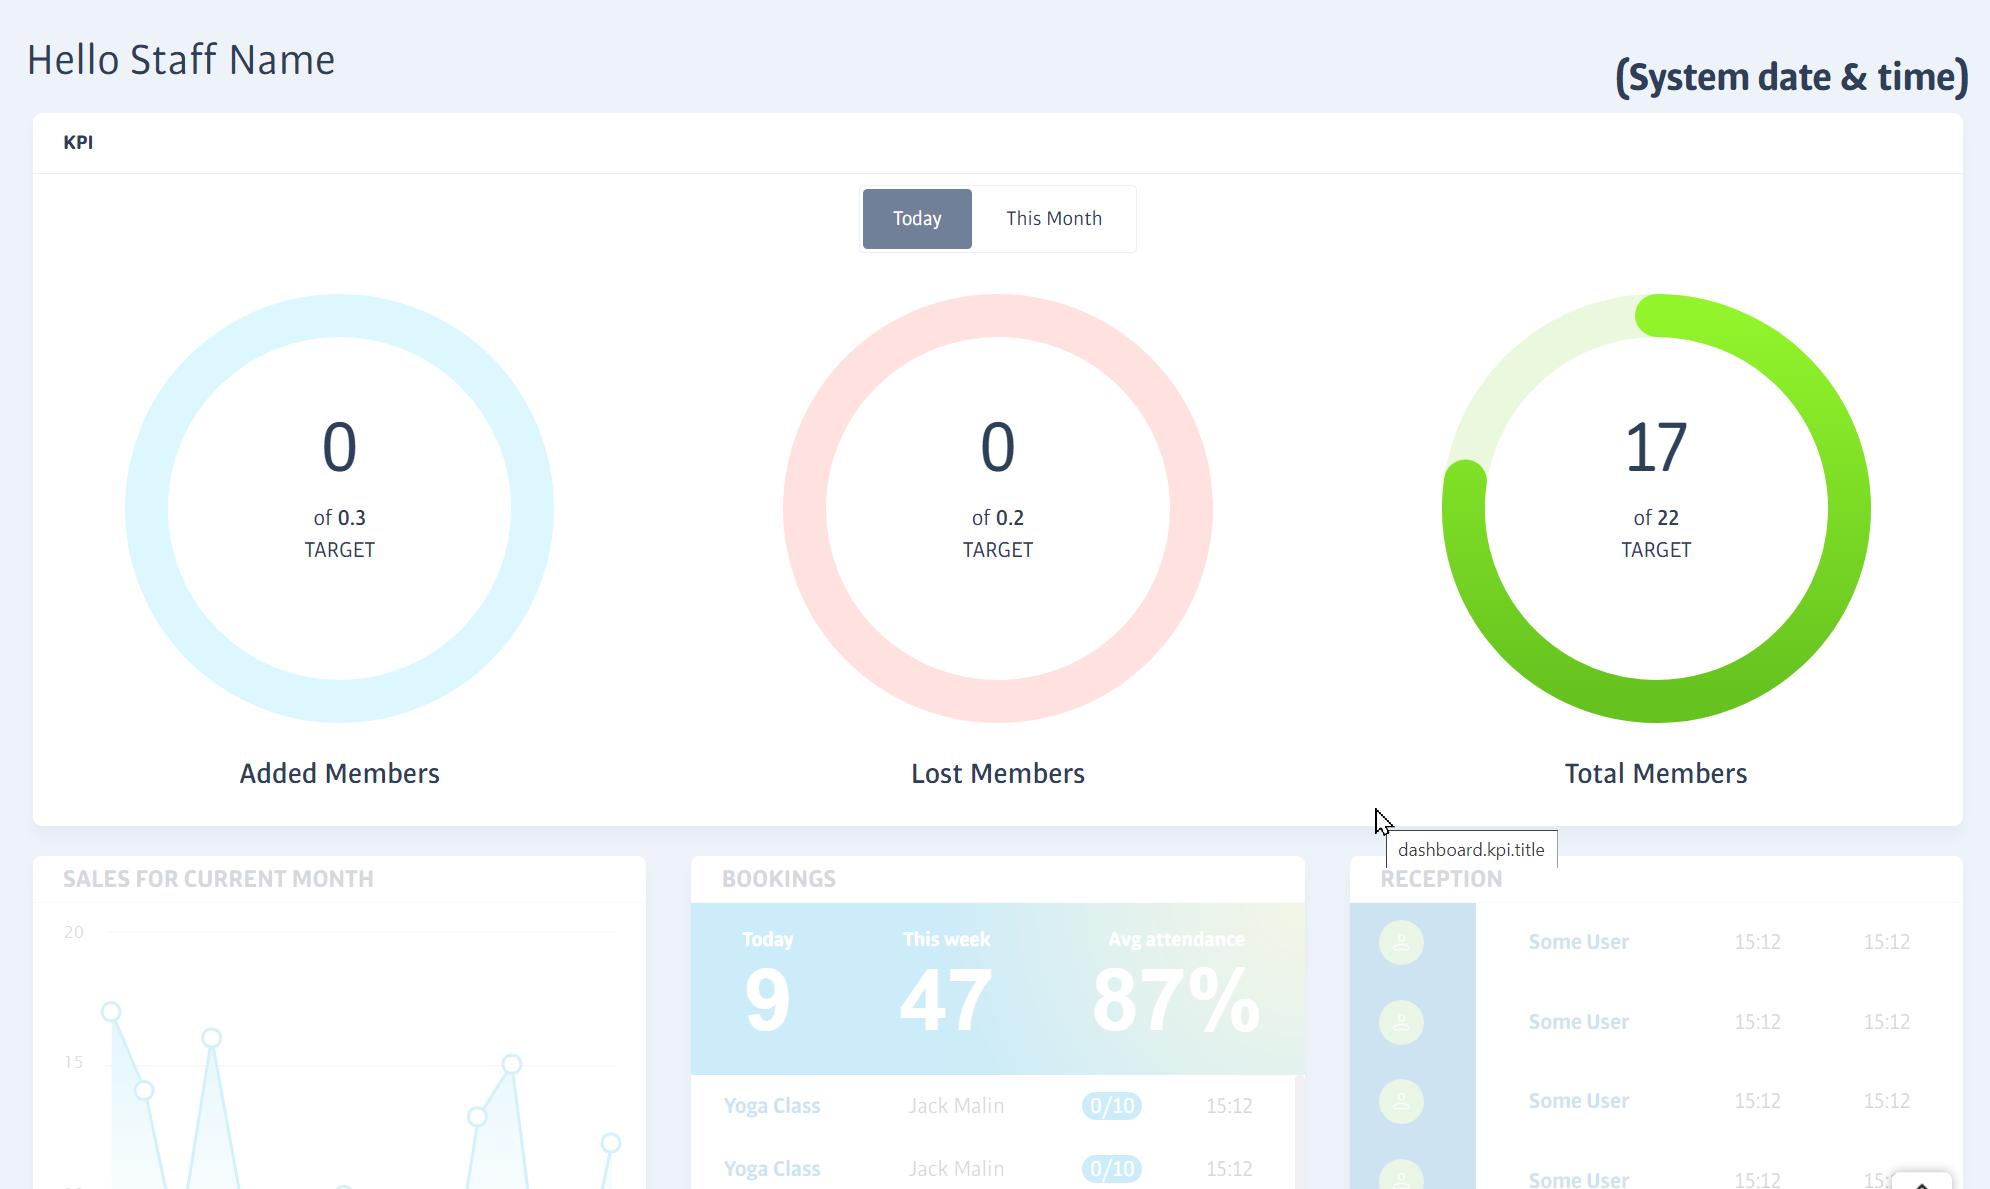
The KPI circles at the top show the overall member activity at the club; the number added or lost this month so far, and the total club membership now.
You can set a monthly target for the first two circles; the third circle showing Total Members is calculated using these first two values.
The monthly targets you set will be scaled when switching between day and month views, e.g. if your monthly target was 30, the daily target would be shown as 1.
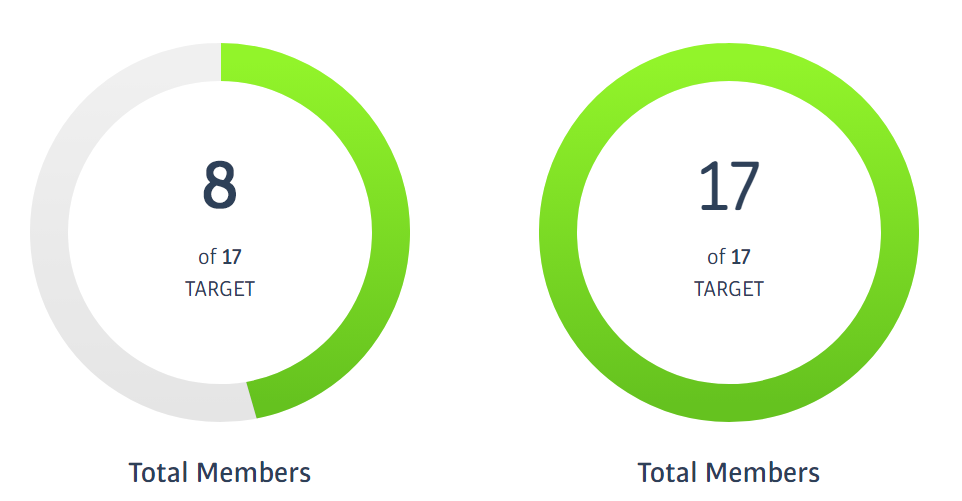
When targets are set, the circles fill-up to show how near to the targets you are, for example here are two different values shown against the same target level:
Note
As the targets are monthly, you must set or edit them in This Month view. The edit icons disappear in Today view.
Tip
Clicking on the title text beneath the circles will expand a section to explain all the contributing metrics, such as Prospects Signed Up, etc.
Dashboard Widgets
Below the circles, you’ll see other useful ‘widgets’ that give summary information about other aspects of the club. The type and number of widgets displayed will vary according to the staff member logged in.
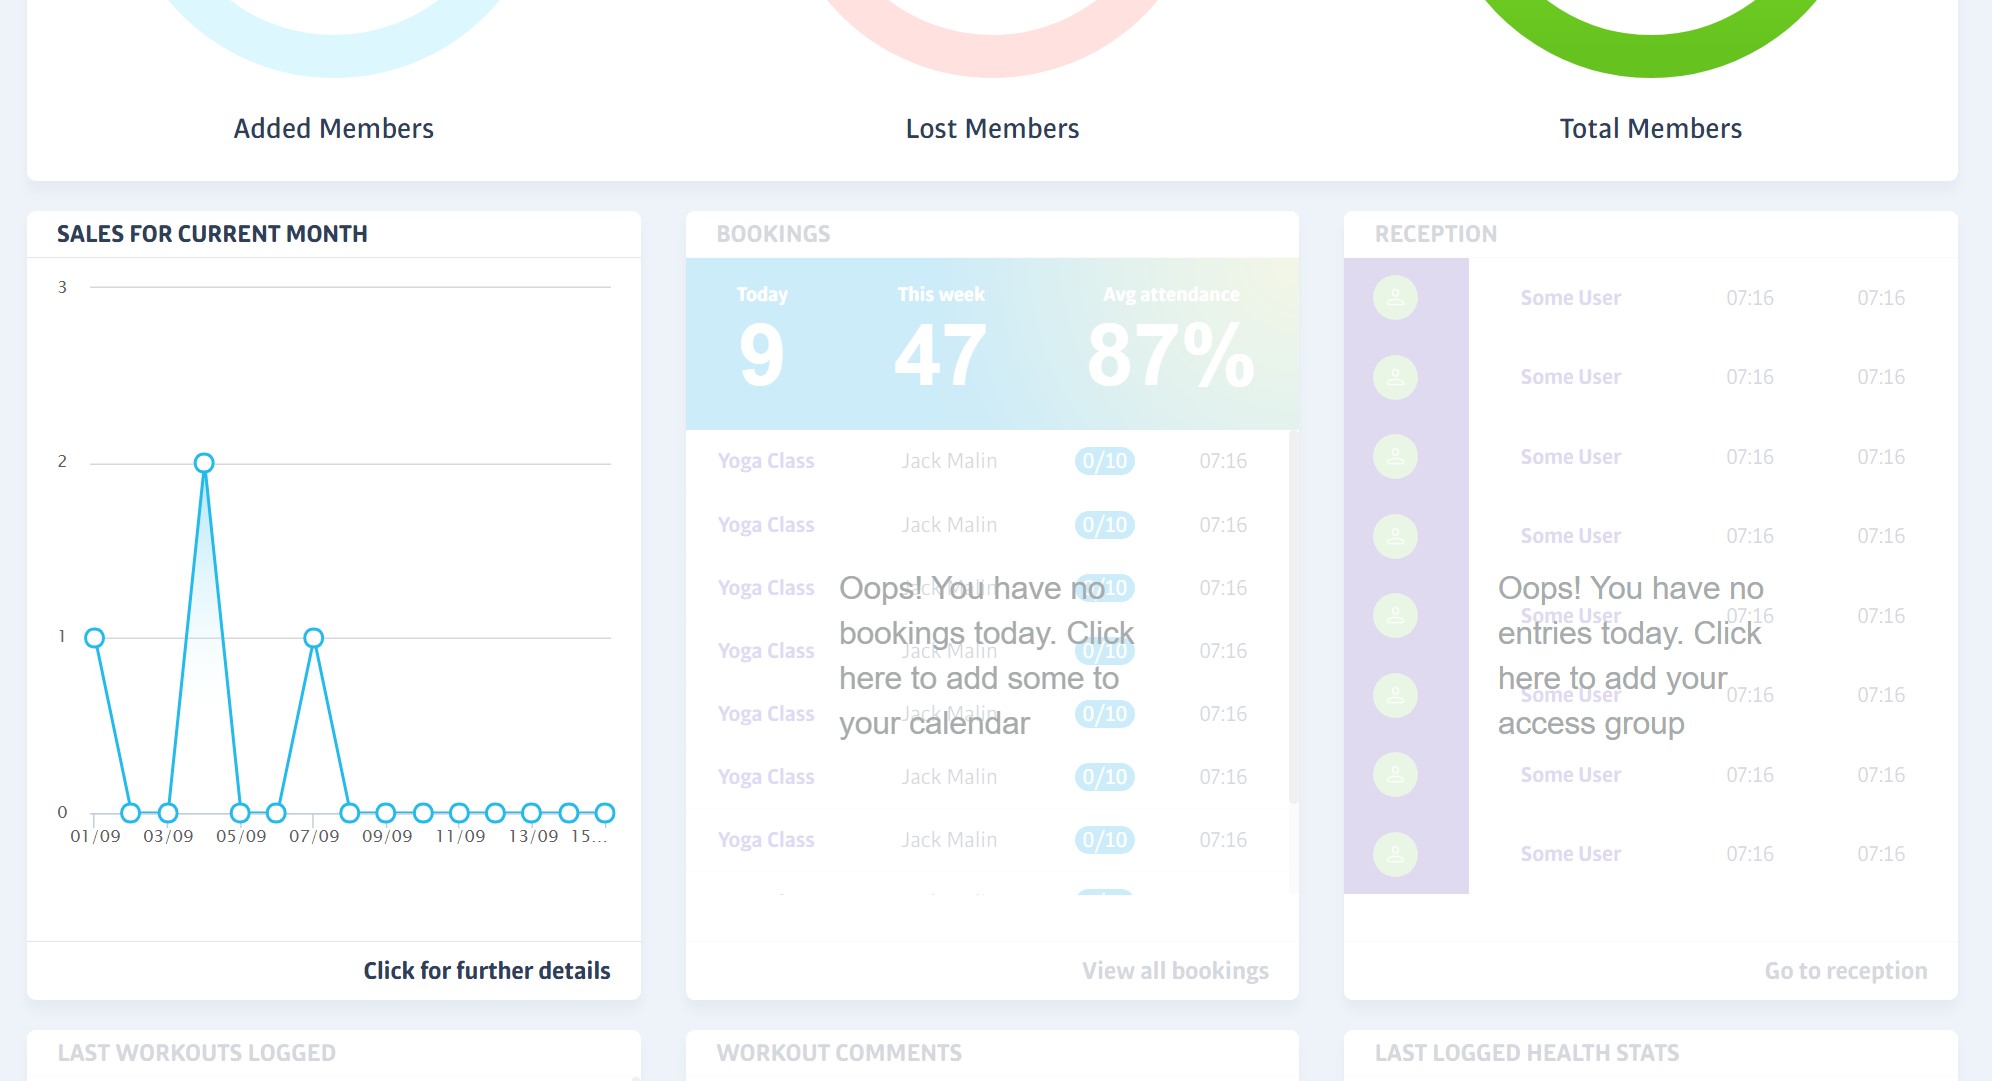
For example, the Reception Widget shows the most recent members to visit the club, you can click this panel to be taken directly to the full Reception screen for even more detail.
Likewise, the Bookings widget will show booking-related performance statistics, in addition to the most recent class bookings. Again, you can click the widget for more details - the full Bookings Calendar in this case.