Report Builder
When you first launch the Report Builder tool, its screen will be mostly blank and the system will be waiting for you to select a report from either of the two menus at the top of the screen:

My Data
This is where you can access your raw club data to build custom reports.
My Reports
The huge range of built-in reports can be found here.
Note
We recommend you try out the built-in reports found in the My Reports menu first to get used to the reporting system.
Expand any of the sections below to find out more:
Head to the My Reports menu to see the full list of reporting categories available to you:
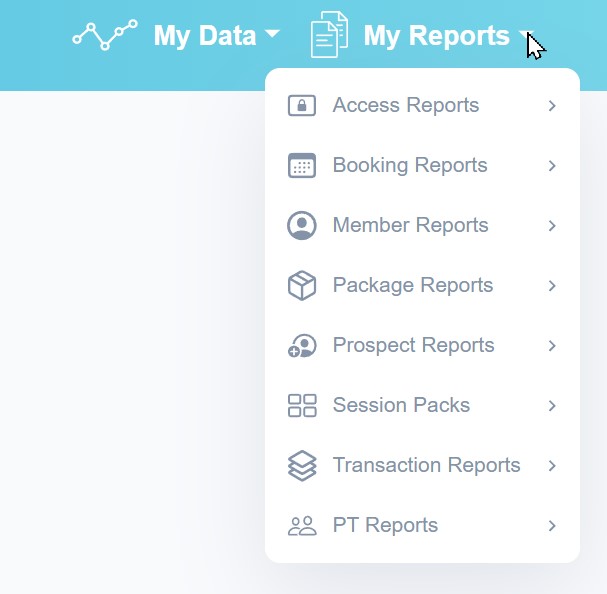
Each category will expand to show the full range of related reports.
For example, a handy summary of your entire membership can be found in Member Reports -> Member Status. Select this report and then click the Run Report button at the lower left of the screen to see the results:
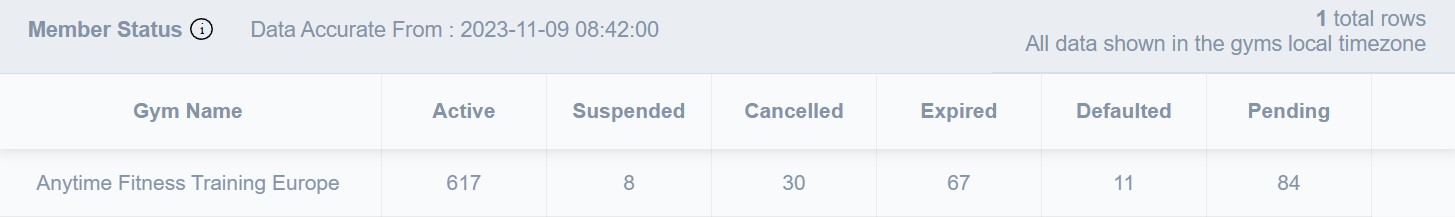
Some reports generate a line or two of summary information like this one, but others can lead to many pages of results.
When this happens use the page navigation tools at the bottom of the screen to step through the pages or adjust the number of items displayed per page.
Date Ranges
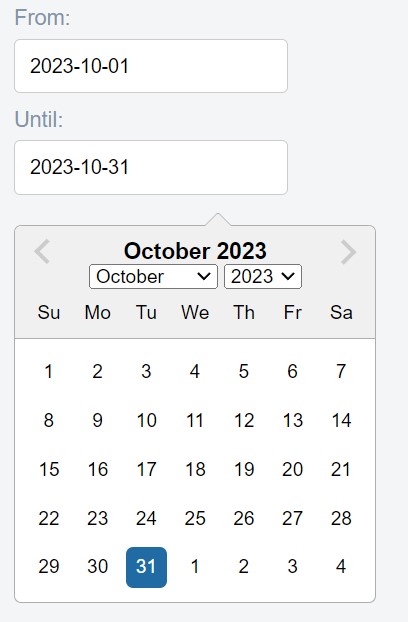
To give the most up-to-date results, many reports display their information based on today's data, or on a month-to-date basis.
To select different time periods, click any of the dates listed on the left to open a date picker:
Other Reports
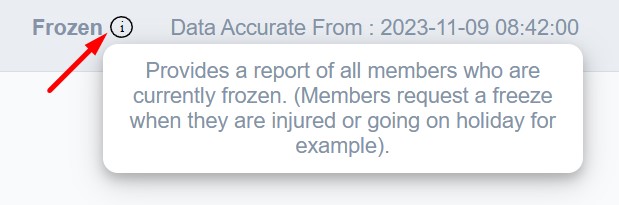
There are many different reports to choose from. To help you understand what each one does, choose any report from the menu and click on its 'i' button next to the report name for a description:
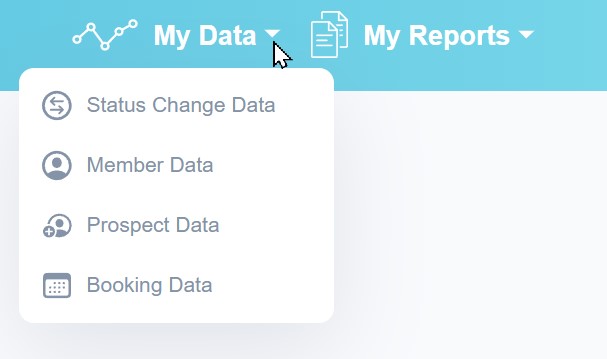
When you select the My Data menu, you are given a list of the basic data sets you can choose to build a report with. You'll see a handful of types like this:
Once you select a data type, you can then apply Filters or Groups to change the way the information is displayed:
Filters
Use filters to extract the information you are interested in, and to discard the remainder.
For example, to see only Active members at the club, you would first choose Member Data, and then choose Status as the filter type, and choose Is Active like this:
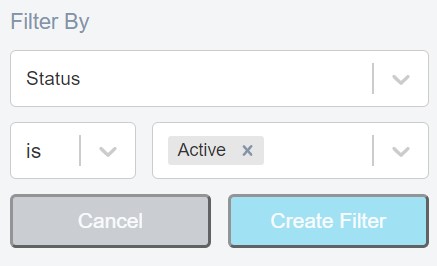
If you Create Filter and run the report now, you will get a report that lists every Active member at your club, potentially several screens long.
Groups
Use groups to summarize your information to make it easier to read.
For example, if you group your member data according to Gender, you will literally get a two-line summary of your entire membership according to sex (including older, expired members).
You can combine multiple filters and/or groups to find exactly the data you need.
For example, you could group by Gender and also group by Status to see the total number of active males, active females, suspended males, suspended females, and so on.
If instead, you filter by Status is Active, and then group by Gender, you will simply get back the number of active males and active females in your membership and no one else.